What did this period bring in?
See total revenue alongside the bookings behind it.

REVENUE & ANALYTICS
A clearer view of your business. Understand performance, compare periods and decide what comes next.
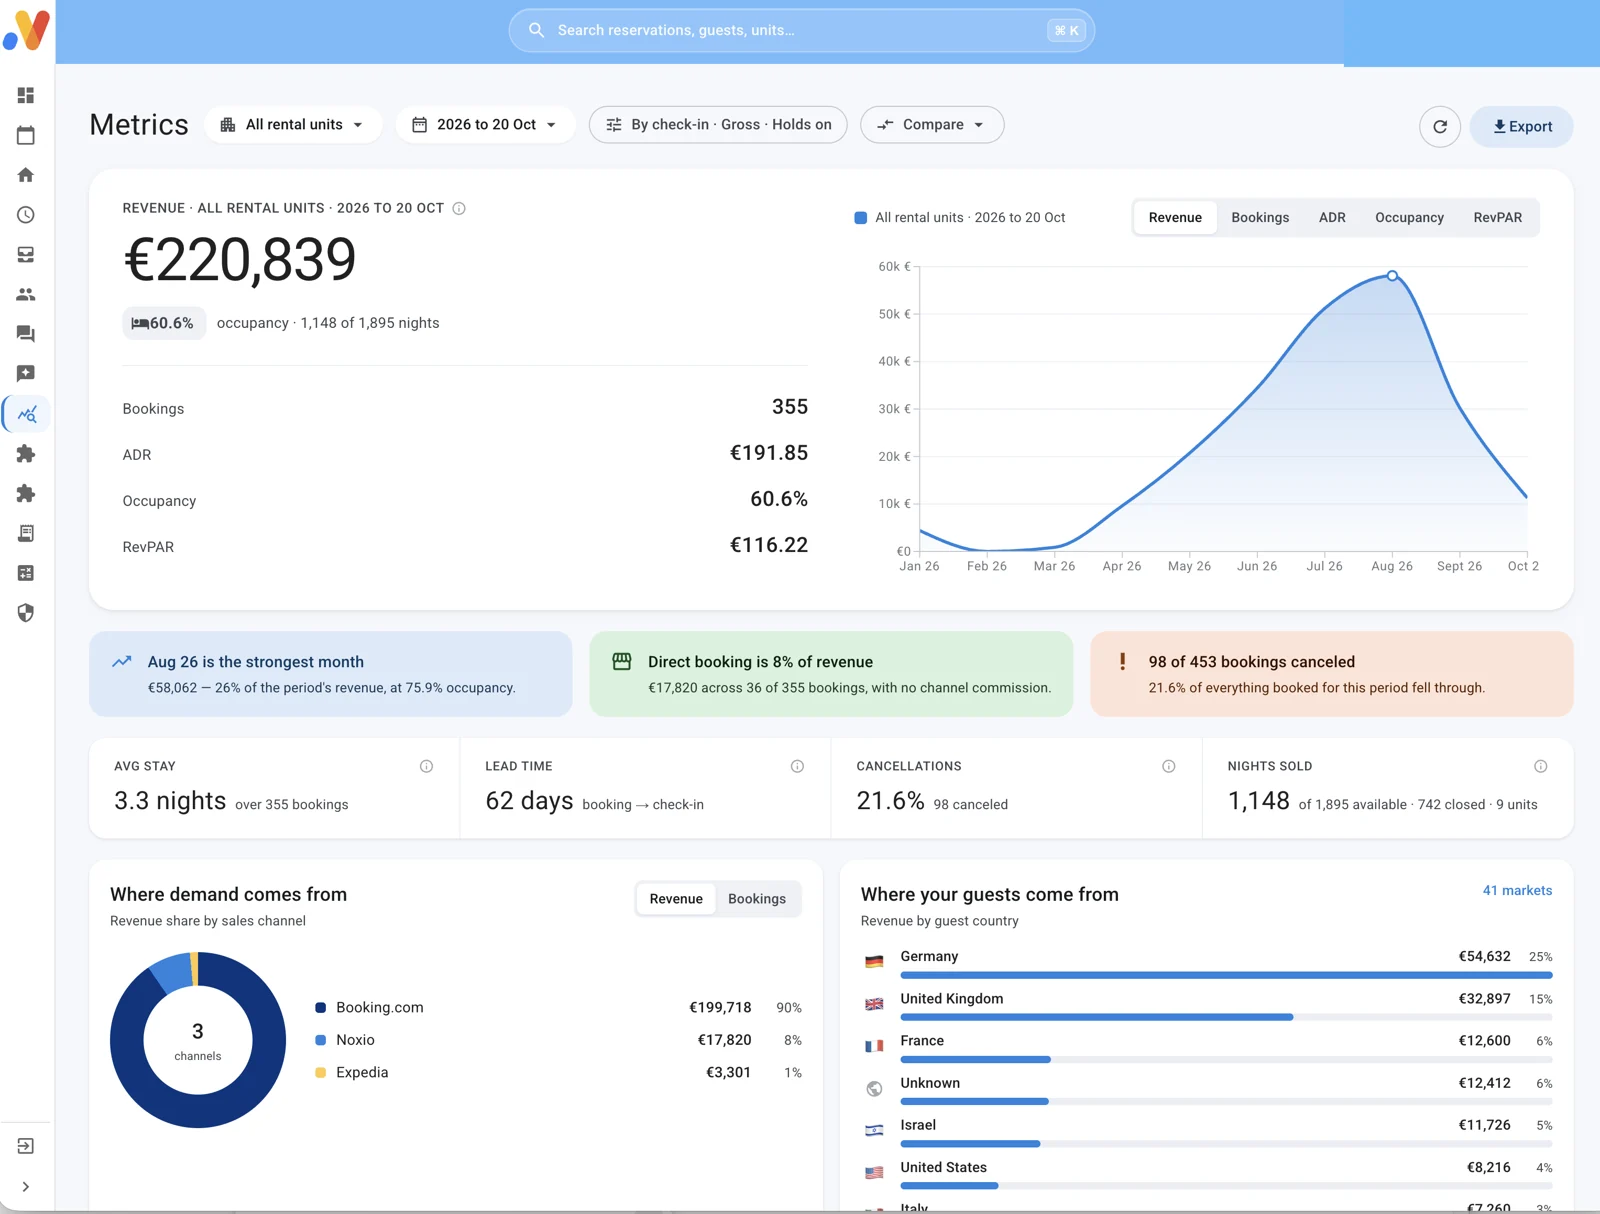
Revenue / Occupancy / ADR / RevPAR
THE DATA IS ALREADY THERE
How many bookings came in? What revenue did they bring? How full was the property? Read the numbers together and the story of your business starts to emerge.
One period. A connected view.
PERFORMANCE AT A GLANCE
Start with the core metrics and read them together. Each reveals a different side of the same period.
See total revenue alongside the bookings behind it.
Read occupancy alongside revenue to look beyond the booking count.
Read ADR together with occupancy for a fuller picture of the period.
Read RevPAR alongside ADR and occupancy as a complementary performance measure.
Metric explanations · choosing one does not change the data in the real image.
01 / OCCUPANCY & DEMAND
See occupancy and bookings for the period you want to understand. Add context with average stay, booking lead time and cancellations.
Scroll sideways for detail, or open the complete image.
02 / REVENUE & PERFORMANCE
Total revenue is the starting point. A month-by-month view, alongside ADR and RevPAR, helps you understand performance across the period.
The trend gives you context. The next decision is yours.
Scroll sideways for detail, or open the complete image.
03 / CHANNELS & SOURCES
Look at revenue by channel, beyond the booking count. Understand what each source contributes to the overall picture.


Channels visible in this particular capture.
Scroll sideways for detail, or open the complete image.
See guest countries alongside bookings from each country to better understand the demand you already have.
CHANGE ADDS PERSPECTIVE
Choose two periods from your history. This October and last October, for example. See what changed in revenue, bookings, ADR, occupancy and RevPAR.
The same unit or group
Illustrative comparison framework · not a product screen or actual results.
A real recording of period selection and comparison will be added here.
FROM THE WHOLE TO THE DETAIL
See all rental units together, choose a group or focus on one room or apartment. Compare the same unit with last year while keeping the context clear.
A detailed recording of filters and channels will be added here.
START WITH A REAL BUSINESS QUESTION
Export your analysis as a PDF to save or print. Use CSV when you want to continue working with the data.
You know your property. Noxio helps you see its performance more clearly.
NOXIO AI
Ask Noxio AI about your revenue in everyday language.
“What was my revenue last month?”Meet Noxio AI →
FAQ
Total revenue, bookings, ADR, occupancy and RevPAR, plus average stay, lead time and cancellations. You can also see revenue by channel and bookings by guest country.
Yes. Choose periods from your history, such as the same month in two different years, and compare performance.
Yes. View all rental units, a selected group or an individual unit, and compare the same unit across different periods.
Yes. Export a PDF to save or print, or a CSV to work with the data.
Discover how Noxio can support your business.
See Noxio in action